From the Lab to the App: a step-by-step tutorial
by Guido España
September 5, 2018
A Shiny App is a package to build interactive web-based applications in R. In science, a Shiny App is a great tool to share research results. In this post, I will walk you through the basic steps to design and publish a shiny app. I will use part of my research as an example.
Some context
The only dengue vaccine licensed has shown an issue with post-vaccination infections. Dengvaxia, developed by Sanofi Pasteur, increases the risk of severe dengue in children with no prior exposure to the dengue virus. Given this negative effect, the WHO recommends Dengvaxia only for children with confirmed prior exposure to dengue virus. In our study, we determined the public health benefits of this type of vaccination.
We modeled vaccination in children with a positive result of previous dengue exposure using a wide range of accuracy of the serological screening tests. We explored this vaccination strategy in several levels of transmission intensity. Due to the noisy nature of our simulation outputs, we used a random forest model as an emulator to smooth the outputs. With this emulator, we calculated the number of cases averted and cost-effectiveness of vaccination programs. In this post, I will use our approximated model for the number of cases averted. To learn more about our research, go to the pre-print of our manuscript in BioRxiv. Also, check out our web-application to explore different scenarios with the model.
In this tutorial, I will use data from our model to estimate the number of severe cases averted with vaccination over a 30-year period. I will use this data in a Shiny App that controls the parameters of the model. Finally, I will describe how to publish this app online. This model and all the code from this tutorial is available to download on Github. To follow this tutorial, you will need to install:
1. The model
We first load the randomForest library, set a random number seed, and load the model.
	      library(randomForest)
	      set.seed(123)
	      mod_hosp_averted = readRDS('./input/model_hosp_test_novax.RDS')
Our model includes five variables:
- Sensitivity: true positive rate of the test to detect previous DENV exposure
- Specificity: true negative rate of the test to detect previous DENV exposure
- Coverage: proportion of children vaccinated
- Age: age of vaccination
- SP9: proportion of children with at least one previous exposure to DENV.
The number of severe dengue cases averted depends on each of these parameters. For instance, vaccination would avert 12% of cases using an 80% sensitive and specific screening test, with a coverage of 80% in a setting with 70% of 9-year-olds with previous exposure to dengue virus. Try it yourself.
	      Intervention_data = data.frame(Sensitivity = 0.8,
	      Specificity = 0.8, Coverage = 0.8,Age = 9, SP9 = 0.7)
	      print(predict(mod_hosp_averted,newdata=intervention_data)
2. Designing the Shiny App
The goal of our Shiny App is to allow users to estimate the benefits of vaccination by exploring different vaccination scenarios. Our Shiny App consists of two components, the user interface and the server. The user interface receives the user’s input and sends it to the server to process. In this tutorial, we will use separate files for each function and save them as: ui.R and server.R.
2.1. The user interface
Our user interface consist of a side-bar where users can adjust the value of the model variables and a main section where the results are displayed.
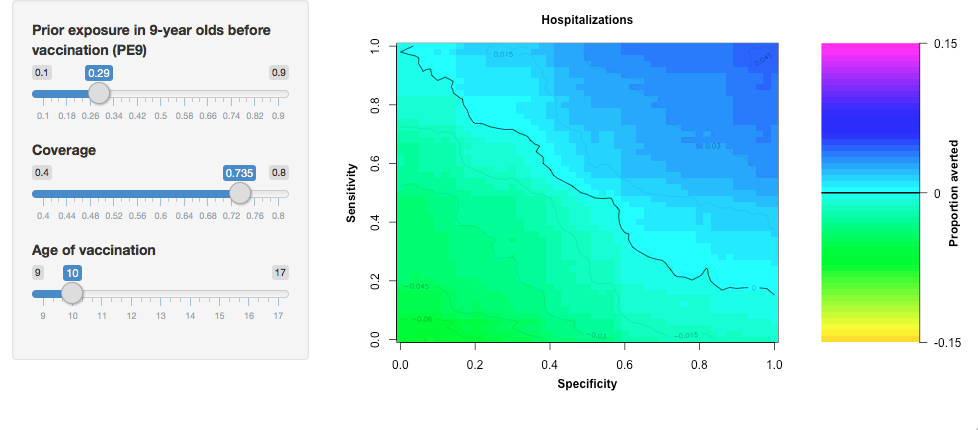
Our application has three sliders to specify the transmission intensity of the region to vaccinate, coverage of the intervention, and the age of vaccination. We specify the sidebar in Shiny with the function sidebarLayout and sidebarPanel. This creates a space for us to locate the sliders for the user. Each slider is an input that the server will later use to create the main plot. The function sliderInput links the input value to the server with an inputId. Input values can be continuous or discrete (steps argument). The minimum and maximum values of the sliders correspond to min and max, respectively. The default value of the slider is called value.
	      sidebarLayout(
              sidebarPanel = sidebarPanel(
              sliderInput(
              inputId = "PE9",
              label = "Prior exposure in 9-year olds before vaccination (PE9)",
              min = 0.1,
              max = 0.9,
              value = 0.7
              ),
              sliderInput(
              inputId = "Coverage",
              label = "Coverage",
              min = 0.4,
              max = 0.8,
              value = 0.8
              ),
              sliderInput(
              inputId = "Age",
              label = "Age of vaccination",
              min = 9,
              max = 17,
              value = 9,
              step = 1
              )
              )
The function mainPanel specifies the main region where our plots are located. You can add the plots to this panel by using the plotOutput function. This function needs to be specified in the server.
mainPanel = mainPanel(plotOutput("plotAverted"))
Finally, we put these two pieces together in a fluidPage layout and assign it to a variable named ui.
	      ui =fluidPage(
	      sidebarLayout(
              sidebarPanel = sidebarPanel(
              sliderInput(
              inputId = "PE9",
              label = "Prior exposure in 9-year olds before vaccination (PE9)",
              min = 0.1,
              max = 0.9,
              value = 0.7
              ),
              sliderInput(
              inputId = "Coverage",
              label = "Coverage",
              min = 0.4,
              max = 0.8,
              value = 0.8
              ),
              sliderInput(
              inputId = "Age",
              label = "Age of vaccination",
              min = 9,
              max = 17,
              value = 9,
              step = 1
              )
              ),
              mainPanel = mainPanel(
              plotOutput("plotAverted")
              )
              )
	      )
2.2. The server
The server reads the input and process it to generate the output.
server = function(input, output){}
In this case, the server reads the input values of the three sliders, renders a plot and assigns it to the plotAverted component of the output.
output$plotAverted = renderPlot({})
The server reads the sliders' input by using the inputID. For instance, age can be accessed using input$Age. The function plot_averted_heatmap uses the random-forest model and the inputs to create the main plot. In this plot, the X-axis corresponds to the specificity of the test and the Y-axis to the sensitivity.
	      server = function(input, output){
	      output$plotAverted = renderPlot({
	      plot_averted_heatmap(model_hosp_averted,
	      input$PE9, input$Age,
              input$Coverage)
	      })
	      }
So far, I have created two files, one for the user interface and one for the server. The function runApp() launches the app in a local computer. Without any arguments, the app looks for the files ui.R and server.R in the current directory. You can download the server.R and ui.R files from my repository on Github.
runApp()
3. Publishing the Shiny App
Up to this point, you should be able to run the app on your computer. But, it might be not a good idea to share this app with others. To run the app your users need to have installed R and all the necessary libraries. Publishing the app to the web allows you to share your app with a wider audience. There are many ways to host Shiny Apps online. To start, I recommend using Shinyapps.io. It hosts web apps for free and the setup is straightforward. However, the free version comes with limitations. For instance, it allows only one user at a time. An alternative is to host Shiny Apps in your own server. If you are in a university, you could use a virtual machine provided by your university for free! In the next section of this tutorial, I will describe these two options.
3.1. Shinyapps.io
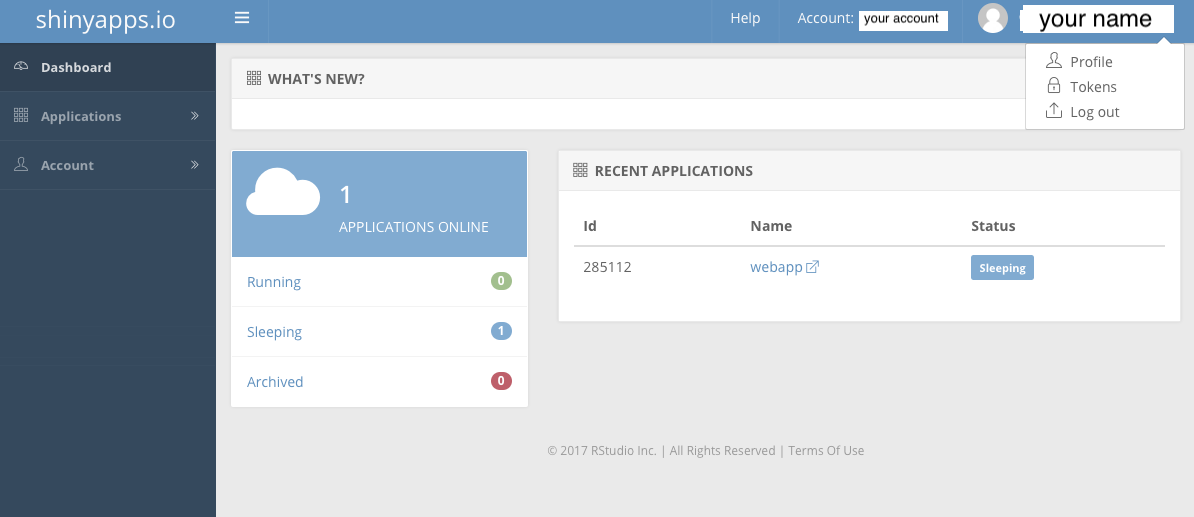
For a more detailed guide, follow the tutorials for Shinyapps.io. You need to create a shinyapps.io account in https://www.shinyapps.io. After creating your account, go to the dashboard, click on the account icon, and select Tokens. Choose your token and click show, then click on show secret.
Copy the command and paste it in your R script.
	      rsconnect::setAccountInfo(name=NAME,
              token=TOKEN,
              secret=SECRET)
Now, we need to install rsconnect package in R and load the library.
	      install.packages(‘rsconnect’)
	      library(rsconnect)
To deploy the app, you simply run the deployApp() command after setting your directory to the app directory. Your app should be in shinyapps.io/name/appname.
3.2. Setting up your own server
With shiny server you can host and manage your web application in your own server. Currently, shiny server is only supported in Linux systems. Detailed instructions can be found in the shiny server user’s guide. The following steps are in the command line. So, login to your server through SSH and continue below.
You first need to install R and the shiny package. This can vary depending on your system. For ubuntu you can use apt or apt-get.
apt-get install r-base
You can specify a secure default CRAN mirror in the file ~/.Rprofile
	      options(download.file.method = "libcurl")
	      local({
	      r = getOption("repos")
	      r["CRAN"] = "https://cran.rstudio.com/"
	      options(repos=r)
	      })
Now, we need to install shiny. For this you can start an R session and type:
install.packages(‘shiny’)
In ubuntu you can install shiny server using gdebi. For more information in this step, follow instructions in the shiny-server download page.
	      sudo apt-get install gdebi-core
	      wget https://download3.rstudio.org/ubuntu-14.04/x86_64/shiny-server-1.5.7.907-amd64.deb
	      sudo gdebi shiny-server-1.5.7.907-amd64.deb
Before starting the server, you should edit the shiny-server configuration file to indicate the port for the server to listen and the directory of your app. This configuration file is located in /etc/shiny-server/shiny-server.conf. Change the location of your app in site_dir. By default, shiny-server points to /srv/shiny-server directory.
	      # Define a server that listens on port 3838
	      server {
	      listen 80;
	      # Define a location at the base URL
	      location / {
	      # Host the directory of Shiny Apps stored in this directory
	      site_dir "Your app’s directory";

	      # Log all Shiny output to files in this directory
	      log_dir /var/log/shiny-server;

	      # When a user visits the base URL rather than a particular application,
	      # an index of the applications available in this directory will be shown.
	      directory_index on;
	      simple_scheduler 50;
	      app_init_timeout 300;
	      }
	      }
Now, we are ready to start our server. Simply type the command:
sudo systemctl start shiny-server
To stop or restart the server, type:
	      sudo systemctl stop shiny-server
	      sudo systemctl restart shiny-server
That's about it. Now, your Shiny App should be online. Visit your URL and make sure things are working as they should. If you need more help, the following links could be useful: